Signal Processing and Generation (signals)
Signal processing, creation and plotting.
Analysis of data and generation of simulated experiments.
-
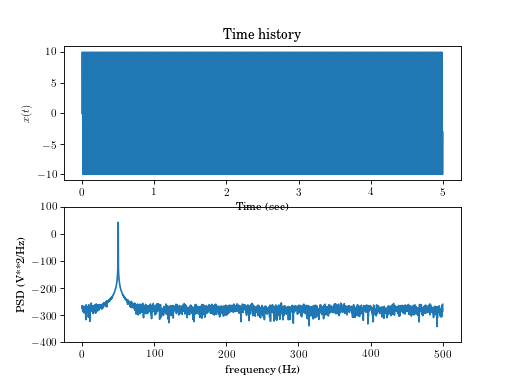
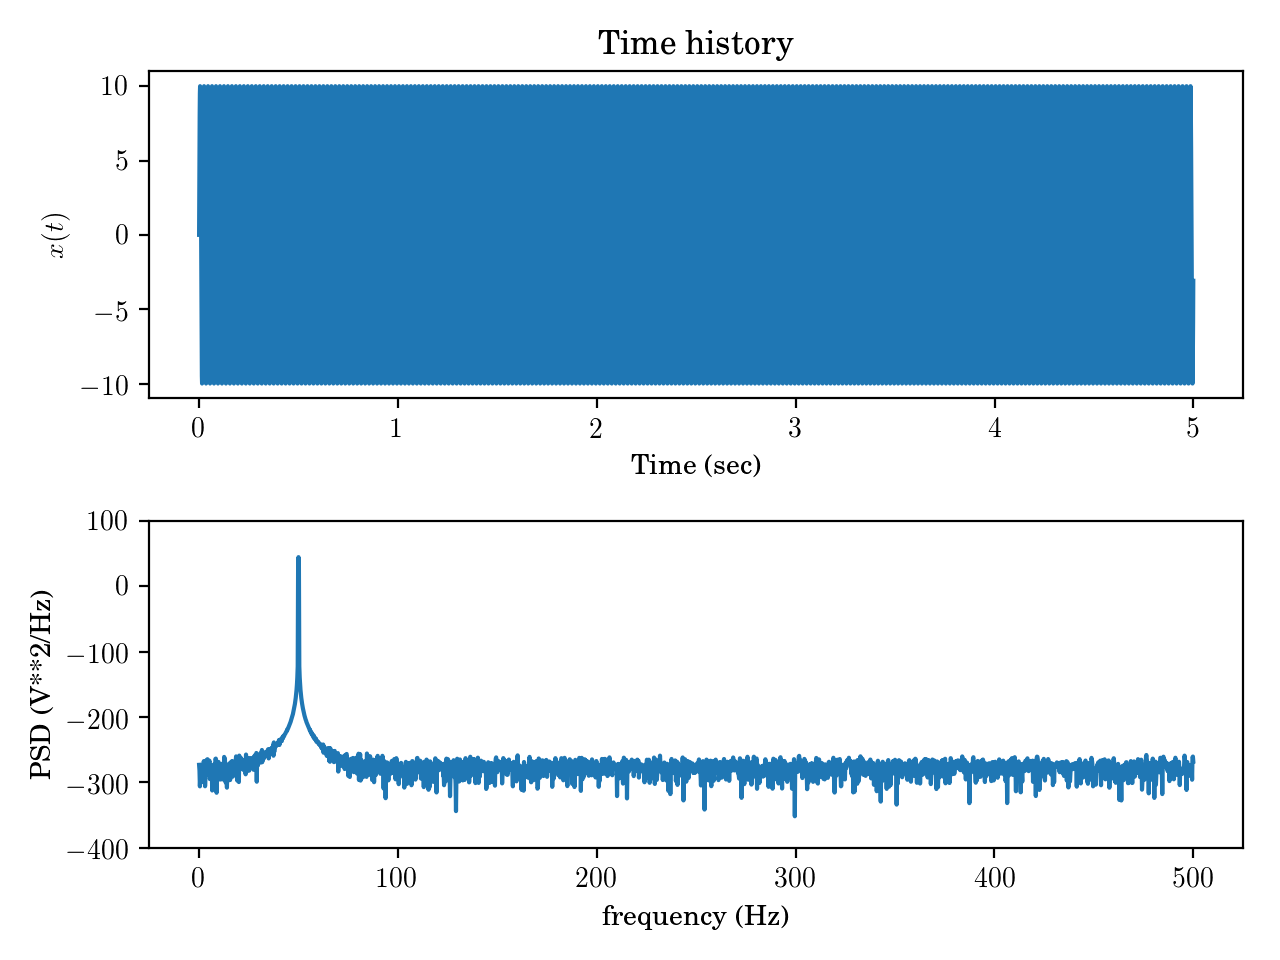
signals.asd(x, t, windowname='hanning', ave=True)[source]¶ Return autospectrum (power spectrum) density of a signal x.
Parameters: x : float array
Data array (n x N x m) where n is the number of sensors, m the number of experiments.
t : float array
Time array (1 x N)
windowname : string
Name of windowing function to use. See window.
ave : bool, optional(True)
Average result or not?
Returns: f : float array
Frequency vector (1 x N)
Pxx : float array
Autospectrum (n x N) or (n x N x m) if not averaged.
Examples
(Source code, png, hires.png, pdf)
-
signals.blackwin(x)[source]¶ Return the n point Blackman window.
Returns x as the Blackman windowing array x_window The windowed signal is then x*x_window
-
signals.boxwin(x)[source]¶ Return the n point box window (uniform).
Returns x as the boxwin windowing array x_windowed The windowed signal is then x*x_window
-
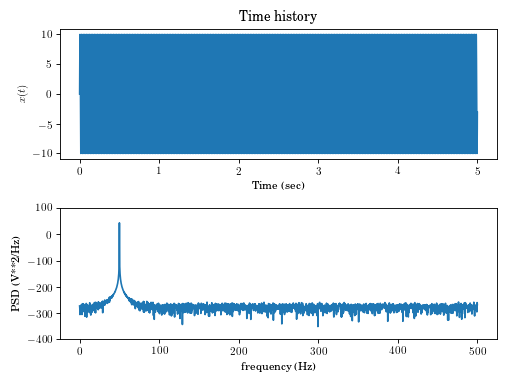
signals.crsd(x, y, t, windowname='hanning', ave=True)[source]¶ Calculate the cross spectrum (power spectrum) density between two signals.
Parameters: x, y : arrays
Data array (n x N x m) where n is the number of sensors, m the number of experiments.
t : array
Time array (1 x N)
windowname : string
Name of windowing function to use
ave : bool, optional
Average result or not?
Returns: f : array
Frequency vector (1 x N)
Pxy : array
Autospectrum (n x N) or (n x N x m) if not averaged.
Examples
(Source code, png, hires.png, pdf)
-
signals.decimate(t, in_signal, sample_frequency)[source]¶ Decimate a signal to mimic sampling anti-aliased signal.
Returns the signal down-sampled to sample_frequency with an anti-aliasing filter applied at 45% of ` sample_frequency`.
Parameters: t : float array
time array, size (N,)
signal : float array
signal array, size (N,), (m,N), or (m,N,n)
sample_frequency : float
new sampling frequency
Returns: time : float array
decimated_signal : float array
Examples
>>> time = np.linspace(0,4,4096)
>>> u = np.random.randn(1,len(time))
>>> ttime, signal_out = decimate(time, u, 100)
-
signals.expwin(x, ts=0.75)[source]¶ Return the n point exponential window.
Returns x as the expwin windowing array x_windowed The windowed signal is then x*x_window The optional second argument set the 5% “settling time” of the window. Default is ts=0.75
-
signals.flatwin(x)[source]¶ Return the n point flat top window.
x_windows=flatwin(x) Returns x as the flat top windowing array x_windowed The windowed signal is then x*x_window McConnell, K. G., “Vibration Testing: Theory and Practice,” Wiley, 1995.
-
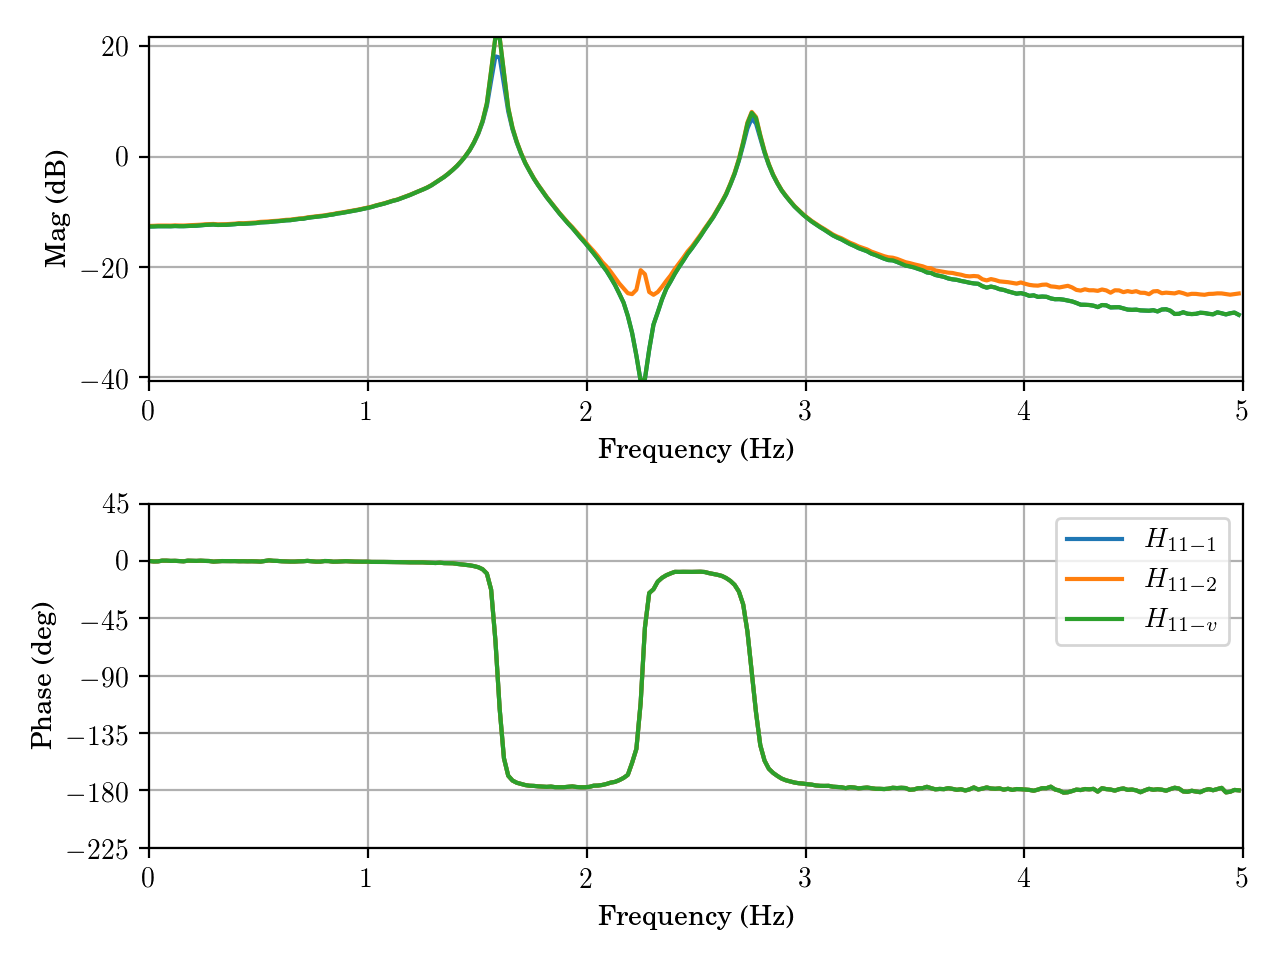
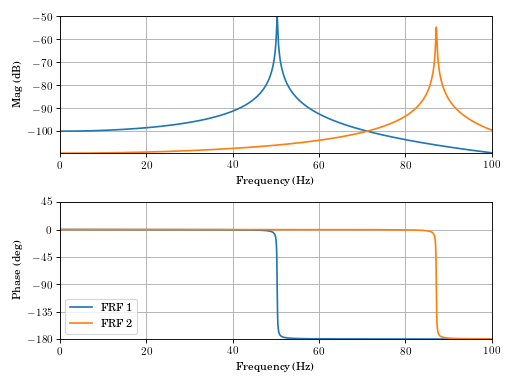
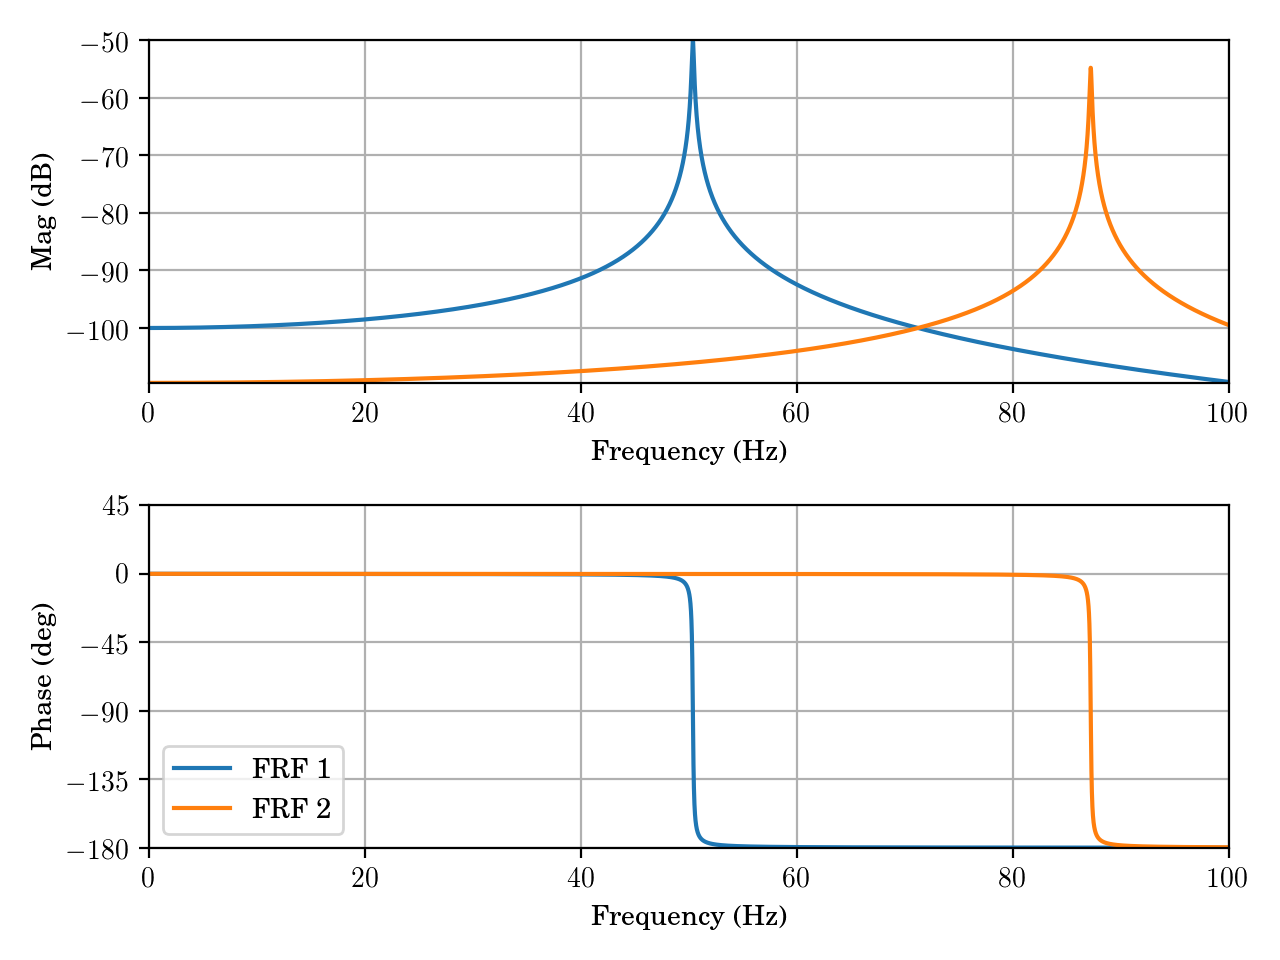
signals.frfest(x, f, dt, windowname='hanning', ave=True, Hv=False)[source]¶ Return freq, H1, H2, coh, Hv.
Estimates the \(H(j\omega)\) Frequency Response Functions (FRFs) between \(x\) and \(f\).
Parameters: x : float array
output or response of system
f : float array
input to system
dt : float
time step of samples
windowname : string
name of leakage window to use
ave : bool, optional(True)- currently locked
whether or not to average PSDs and ASDs or calculate raw FRFs
Hv : bool, optional(False)
calculate the \(H_v\) frequency response function
Returns: freq : float array
frequency vector (1xN)
H1 : float array
Frequency Response Function \(H_1\) estimate, (nxN) or (nxNxm)
H2 : float array
Frequency Response Function \(H_2\) estimate, (nxN) or (nxNxm)
coh : float array
Coherance Function \(\gamma^2\) estimate, (nxN)
Hv : float array
Frequency Response Function \(H_v\) estimate, (nxN) or (nxNxm)
Currently
windownameandaveare locked to default values.Notes
Note
Not compatible with scipy.signal functions
Warning
hanning window cannot be selected yet. Averaging cannot be unslected yet.
Todo
Fix averaging, windowing, multiple input.
Examples

-
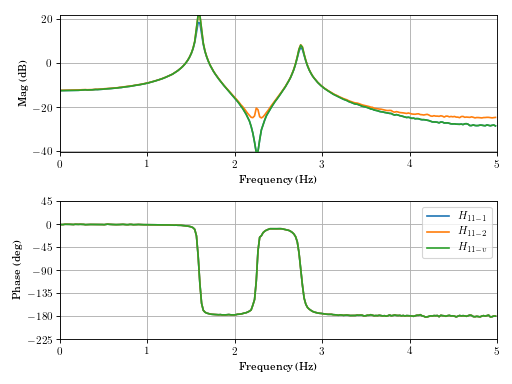
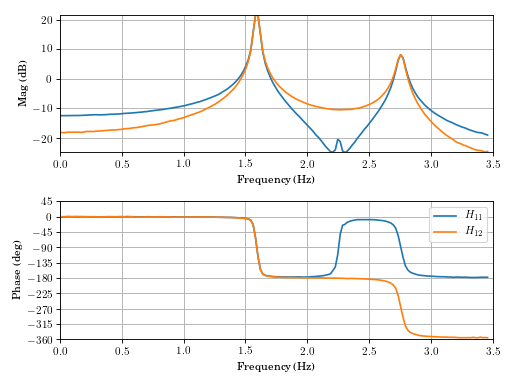
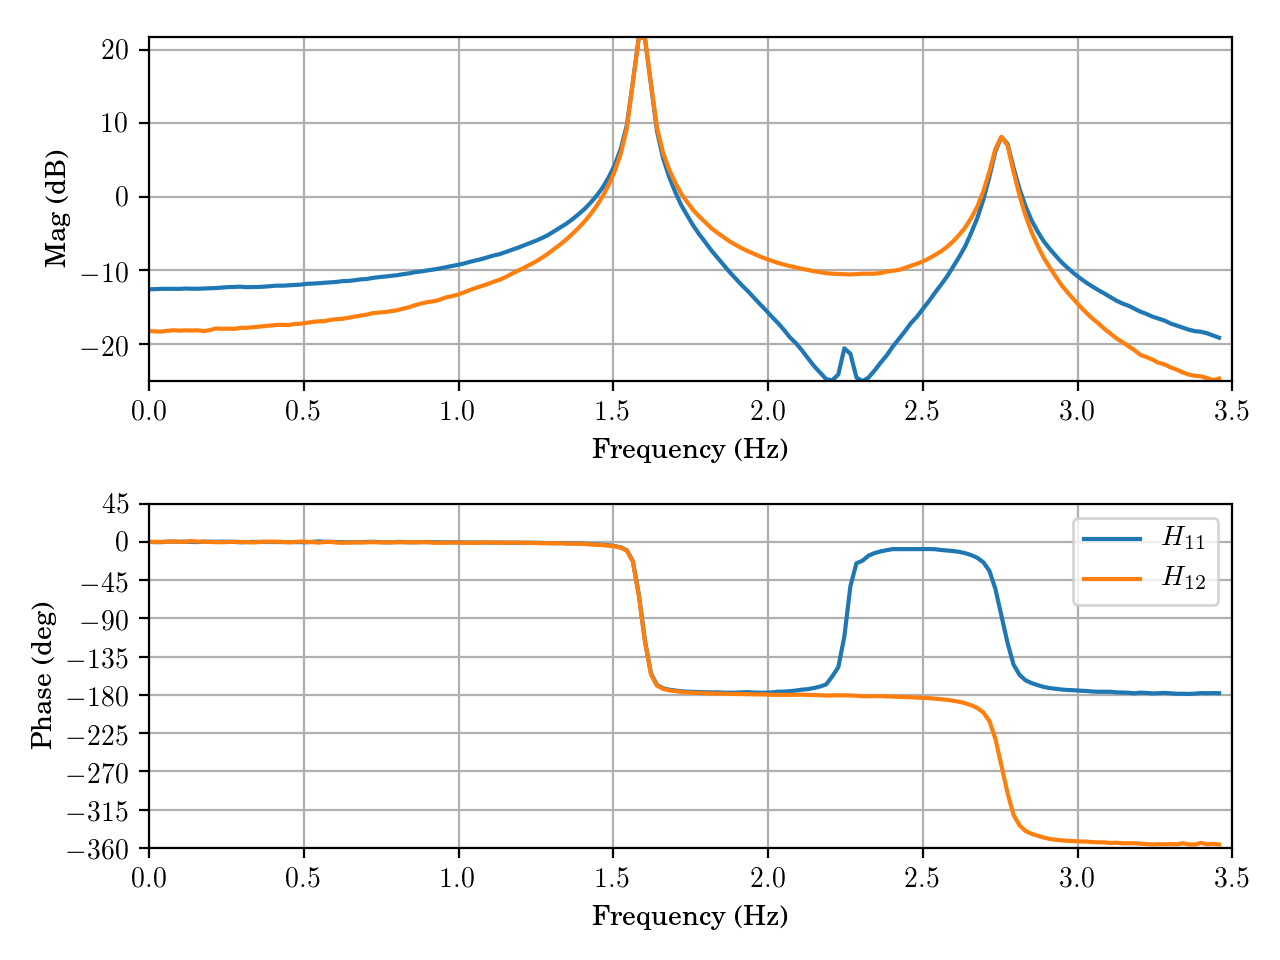
signals.frfplot(freq, H, freq_min=0, freq_max=None, type=1, legend=[])[source]¶ Frequency Response function pretty plotting.
Plots frequency response functions in a variety of formats
Parameters: freq : float array
Frequency vector (rad/sec), (1xN)
H : float array
Frequency response functions (nxN)
freq_min : float, optional
Low frequency for plot (default 0)
freq_min : float, optional
High frequency for plot (default max frequency)
legend : string array
Array of string for use in legend.
type : int, optional
Plot type. See notes.
Returns: ax : axis objects
allows manipulation of plot parameters (xlabel, title…)
Notes
type Plot style 1 (def) Magnitude and Phase versus F 2 Magnitude and Phase versus log10(F) 3 Bodelog (Magnitude and Phase versus log10(w)) 4 Real and Imaginary 5 Nyquist (Imaginary versus Real) 6 Magnitude versus F 7 Phase versus F 8 Real versus F 9 Imaginary versus F 10 Magnitude versus log10(F) 11 Phase versus log10(F) 12 Real versus log10(F) 13 Imaginary versus log10(F) 14 Magnitude versus log10(w) 15 Phase versus log10(w) See also
frfest
Copyright J. Slater, Dec 17, 1994 Updated April 27, 1995 Ported to Python, July 1, 2015
Examples
(Source code, png, hires.png, pdf)
-
signals.hammer_impulse(time, imp_time=None, imp_duration=None, doublehit=False, dh_delta=None)[source]¶ Generate simulated hammer hit (half sine).
Parameters: time : float array
1 x N time array. Suggest using np.linspace(0,10,1000).reshape(1,-1) for example
imp_time : float (optional)
Time of onset of impulse. Default is 0.1 time end time- which traditionally works well for impact testing
imp_duration : float (optional)
Duration of impulse. Default is 0.01 of total record
doublehit : Boolean (optional)
Allows repeat of hit to emulate a bad strike. Default is False
dh_delta : float (optional)
Time difference between primary strike and accidental second strike Default is 0.02 of record.
Returns: force : float array
Examples
>>> import vibrationtesting as vt
>>> time = np.linspace(0,10,1024).reshape(1,-1)
>>> force = vt.hammer_impulse(time, doublehit=True)
>>> plt.plot(time.T, force.T)
[<matplotlib.lines.Line2D object...
-
signals.hammwin(x)[source]¶ Return the n point hamming window.
Returns x as the hamming windowingarray x_windowed The windowed signal is then x*x_window
-
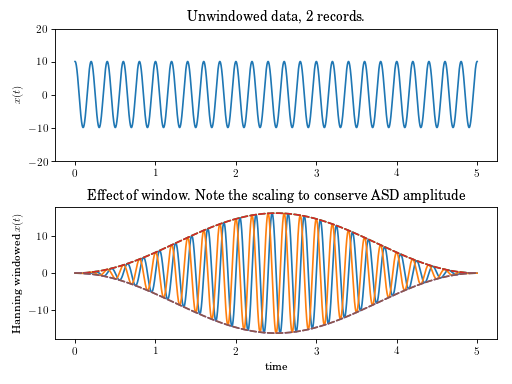
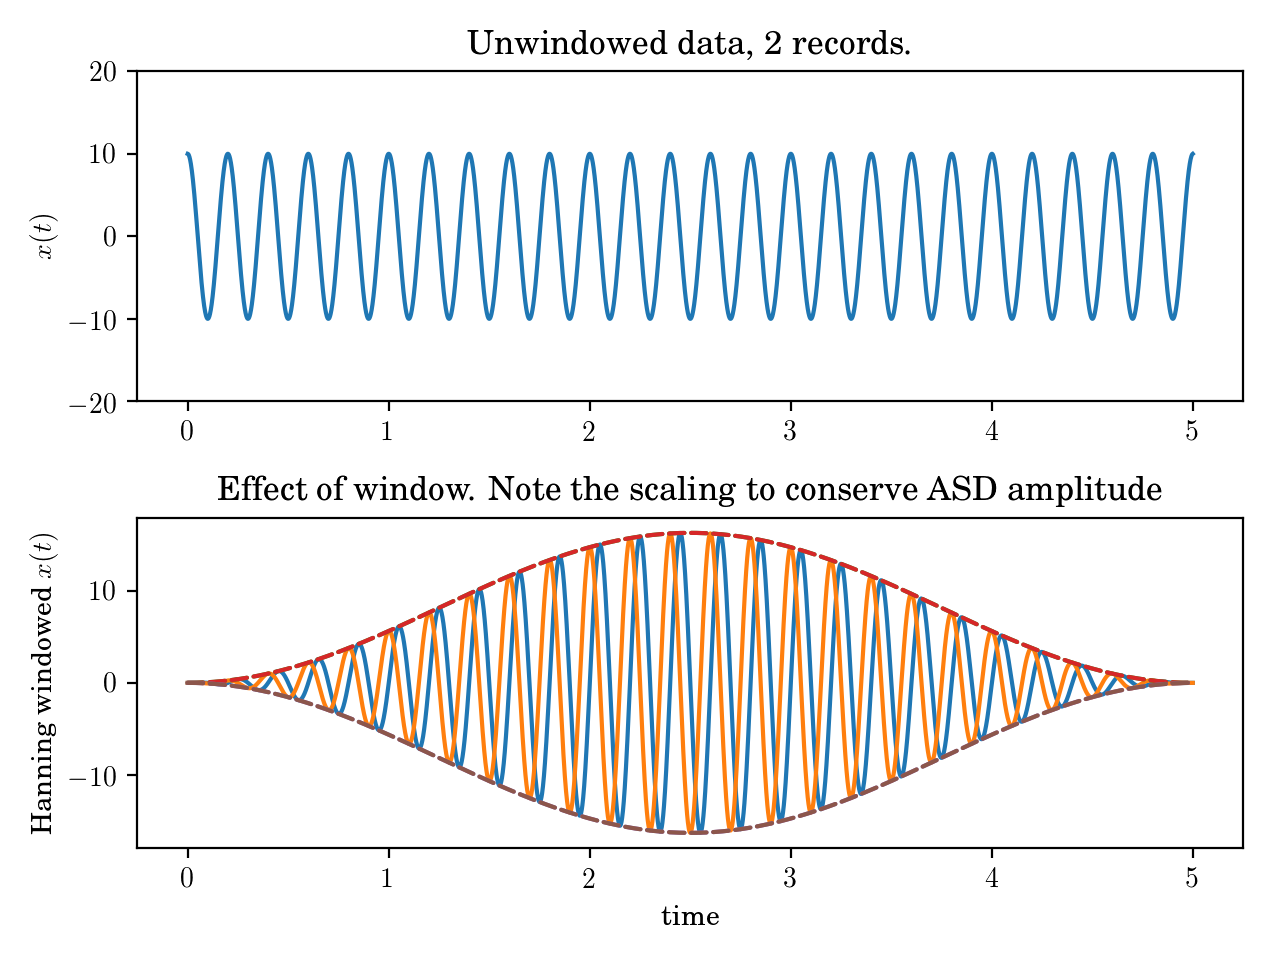
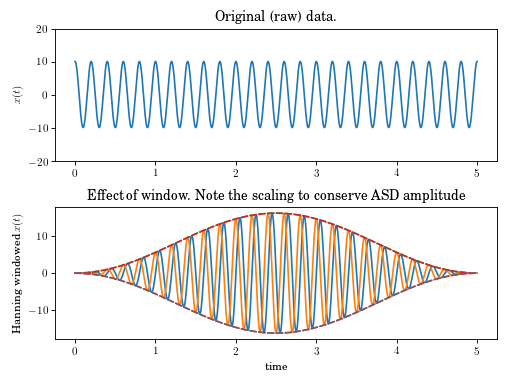
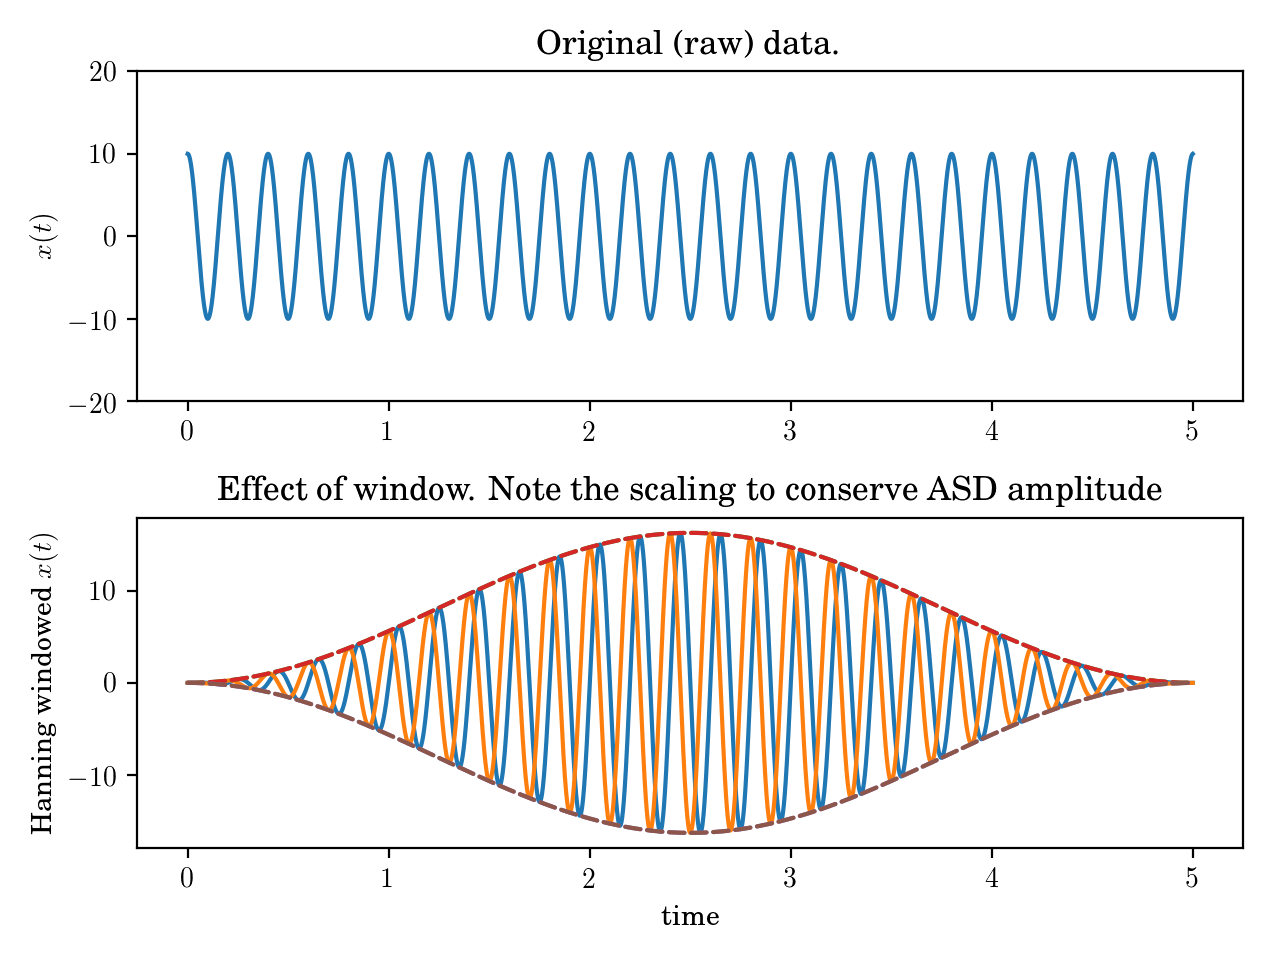
signals.hanning(x, normalize=False)[source]¶ Return hanning window.
Create a hanning window of length \(x\), or a hanning window sized to match \(x\) that \(x\times w\) is the windowed result.
Parameters: x: integer, float array
If integer- number of points in desired hanning windows.If array- array provides size of window returned.windowname: string
One of: hanning, hamming, blackman, flatwin, boxwin
normalize: bool, optional(False)
Adjust power level (for use in ASD) to 1
Returns: w: float array
window array of size xwindow array. Windowed array is then \(x\times w\)Examples
(Source code, png, hires.png, pdf)

-
signals.window(x, windowname='hanning', normalize=False)[source]¶ Create leakage window.
Create a window of length \(x\), or a window sized to match \(x\) that \(x\times w\) is the windowed result.
Parameters: x: integer, float array
If integer- number of points in desired hanning windows.If array- array provides size of window returned.windowname: string
One of: hanning, hamming, blackman, flatwin, boxwin
normalize: bool, optional(False)
Adjust power level (for use in ASD) to 1
Returns: w: float array
window array of size xwindow array. Windowed array is then \(x\times w\)Examples
(Source code, png, hires.png, pdf)